It’s no secret that the Cubs have had a less than optimal start to the season. They needed two straight wins in Philadelphia to get back to the .500 mark, and are in last place in the NL Central. However, that only puts them 1.5 games back of the leaders.
But disappointing starts for the projected leaders has been a trend across MLB early this season – with one notable exception. This, of course, has led to a number of surprising starts for teams not expected to do so well.
Here were the 6 projected division champions according to ZIPS, their actual and projected winning percentages, and the difference.
| Team | Actual Win % | Projected win % | Difference |
|---|---|---|---|
| Red Sox | 0.389 | 0.556 | -0.167 |
| Tigers | 0.526 | 0.531 | -0.005 |
| Mariners | 0.400 | 0.543 | -0.143 |
| Phillies | 0.444 | 0.562 | -0.118 |
| Cubs | 0.500 | 0.537 | -0.037 |
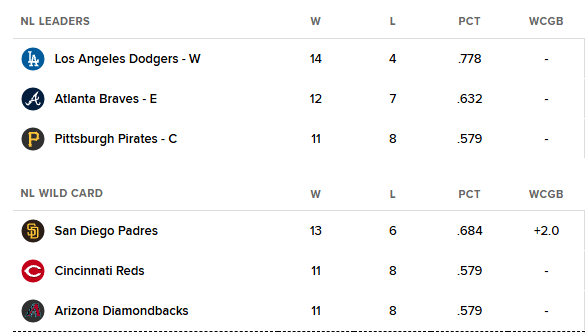
| Dodgers | 0.778 | 0.599 | +0.179 |
That is a collective -0.291 winning percentage among the projected division winners, even with the Dodgers performing better than expected.
But it is not just the division winners who have been struggling. For the other teams that were projected to finish above .500 by ZIPS, here are the actual and projected percentages, sorted by the biggest negative difference to biggest positive difference.
| Team | Actual Win % | Projected win % | Difference |
|---|---|---|---|
| Mets | 0.368 | 0.549 | -0.181 |
| Blue Jays | 0.389 | 0.549 | -0.160 |
| Giants | 0.368 | 0.519 | -0.151 |
| Royals | 0.368 | 0.506 | -0.138 |
| Astros | 0.400 | 0.519 | -0.119 |
| Orioles | 0.474 | 0.543 | -0.069 |
| Yankees | 0.526 | 0.543 | -0.017 |
| Rangers | 0.526 | 0.500 | +0.026 |
| Brewers | 0.556 | 0.525 | +0.031 |
| Diamondbacks | 0.579 | 0.506 | +0.073 |
| Braves | 0.632 | 0.519 | +0.113 |
| Padres | 0.684 | 0.512 | +0.172 |
That is a collective difference of a -0.420 win percentage, despite strong starts by the Padres and Braves.
For the 12 teams the ZIP projected to make the playoffs, only 1 AL team (the Tigers) and 2 NL Teams (the Dodgers and Braves) would make it based on current record. So there’s a LOT of disappointment to go around.
On the flip-side, because to many teams projected to do well are playing poorly, that means many teams projected to finish below .500 are performing well above expectations.
| Team | Actual Win % | Projected Win % | Difference |
|---|---|---|---|
| Rays | 0.611 | 0.457 | +0.154 |
| Reds | 0.579 | 0.469 | +0.110 |
| Twins | 0.579 | 0.475 | +0.104 |
| Pirates | 0.579 | 0.488 | +0.091 |
| Cardinals | 0.556 | 0.469 | +0.087 |
| Angels | 0.500 | 0.414 | +0.086 |
| Nationals | 0.474 | 0.389 | +0.085 |
| Guardians | 0.550 | 0.481 | +0.069 |
| Athletics | 0.526 | 0.457 | +0.069 |
| Marlins | 0.474 | 0.469 | +0.005 |
| Rockies | 0.368 | 0.370 | -0.002 |
| White Sox | 0.316 | 0.444 | -0.128 |
This is a combine +0.730 winning percentage for the teams picked to finish below 500.
- 8 of the 12 teams picked to finish with losing records are at .500 or above
- 10 of the 12 teams have a higher win percentage than expected, and one is almost exactly at the projected win percentage
- Only one team, the White Sox are falling well below expectations
So what does it all mean? Should we expect these results to hold, and for the playoffs to be filled with teams that were not expected to be there?
The answer is no. What we are seeing is the early season noise of baseball, where some teams do much better then expected early and other teams do worse. It is a particularly crazy season, with almost every team going against preseason predictions.
But from a fan perspective, I think it shows that we should not overreact to early season results. Certainly a few of these will hold – with a few teams projected to do well faltering (see the Braves, Mets, Orioles and Astros in 2025) and some surprises will emerge (such as the Blue Jays, Tigers, Reds and Brewers last season). But the is zero possibility that any 3 of the 12 projected playoff teams according to ZIPS will make the actual playoffs when all the dust settles.
Be patient. There will be time to panic in a couple of a month or two, when we will have a better idea of who the real surprises will be.

Leave a comment