
“It’s the best offense in the majors” was a phrase we heard often toward the end of the season, especially from Boog Sciambi, about the Cubs offense in 2026. And, as far as runs scored, which is the consensus measuring point, they were the best. The Cubs scored 850 runs in 2026, which was 18 more than the 2nd place Brewers.
No, the pitching was a different story, with the Cubs at 12th, 103 runs behind the Dodgers and 85 behind the Brewers. And this was with an elite defense that was by far the best in the league. So, the pitching is obviously the largest component that held the team back from being a true contender.
But when the team needed the offense to step up and carry them, they were not able to do it, scoring 9 runs over 5 games in which they went 1-4, when home field for the Wild Card round would have been locked up if they could have gone 3-2. And then in the Playoffs, they scored a grand total of 1 run over 2 games.
This made me curious about the Cubs offense, and whether their top spot in runs scored might have been misleading, due to so many lopsided victories.
Run differential in baseball has often been a very good predictor of a team’s future success. But in the current state of major league baseball, with position players coming into blowout games, and teams using low leverage relievers when a game does not appear to be winnable, it seems much easier to make a team’s offensive numbers appear better than their underlying ability.
In addition, have a large lead can psychologically provide hitters with less stress and make it easier to produce. Although, this is something that would be very difficult to prove.
But lets take a look at the Cubs in 2026, and how they did based on single game margin of loss or victory.
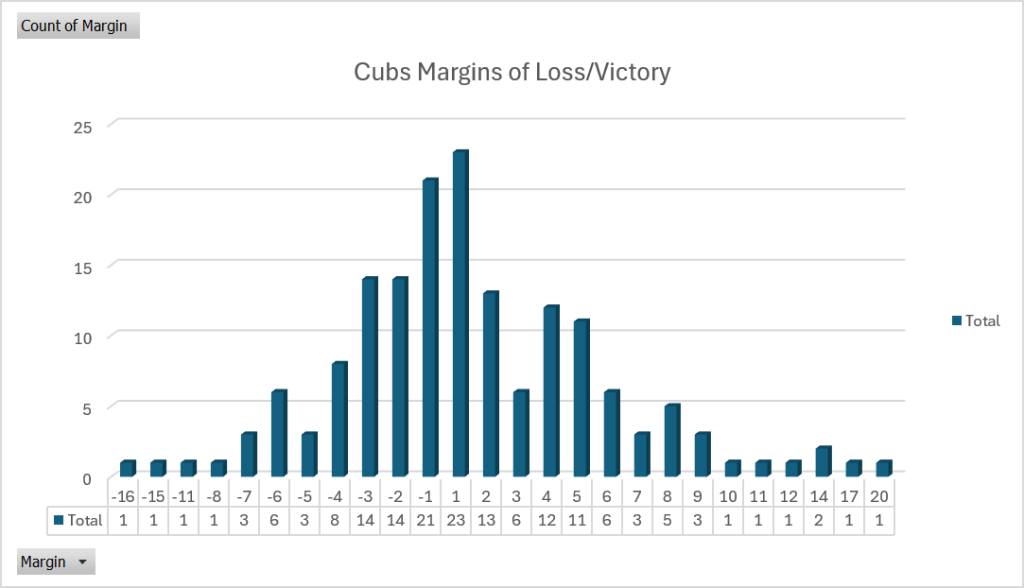
Let’s break that down into some boxes
| Margin | Record |
|---|---|
| 1 or 2 runs | 36-35 |
| 3 or 4 runs | 18-22 |
| 5 or 6 runs | 17-9 |
| 7+ runs | 18-7 |
So, when the Cubs had a margin of 5 or more runs, they were 35-16, but when the margin was close they were 54-57, below .500. Winning these blowouts certainly helped the offense prop up their stats, but it did not help their win total so much.
Let’s compare that number to the Brewers
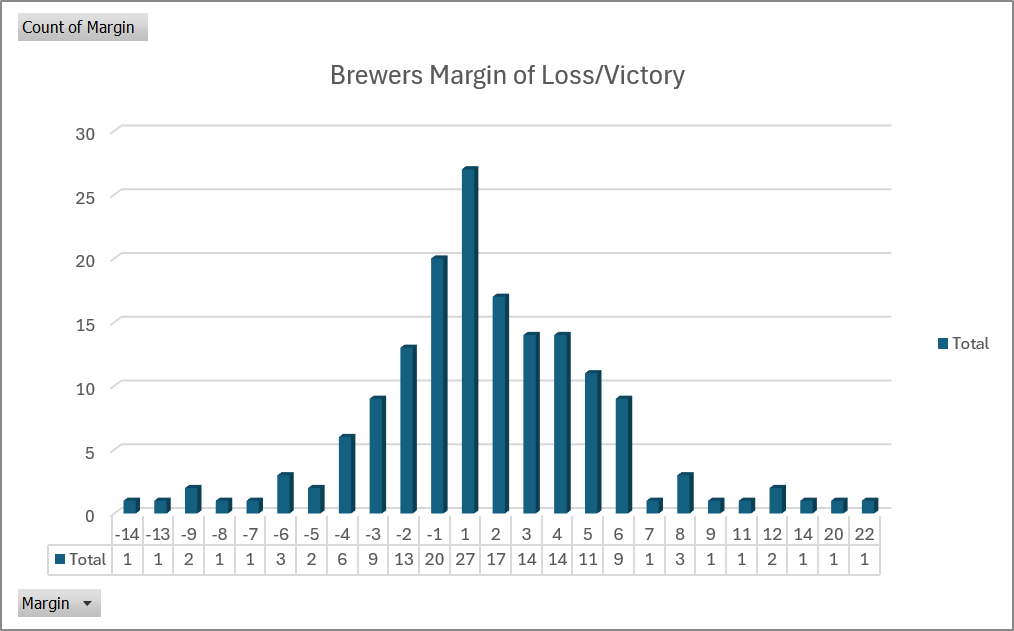
An here are the records
| Margin | Record |
|---|---|
| 1 or 2 runs | 44-33 |
| 3 or 4 runs | 28-15 |
| 5 or 6 runs | 20-5 |
| 7+ runs | 11-6 |
So, despite winning 14 fewer games, the Cubs actually had 4 games more than the Brewers when they won by 7 or more runs. Meanwhile in games decided by 4 or fewer runs, the Brewers were an amazing 72-48.
Let’s look a another good offensive team that did not have as good of a record, the Washington Nationals. They were third in the league in runs scored, but finished 77-85.
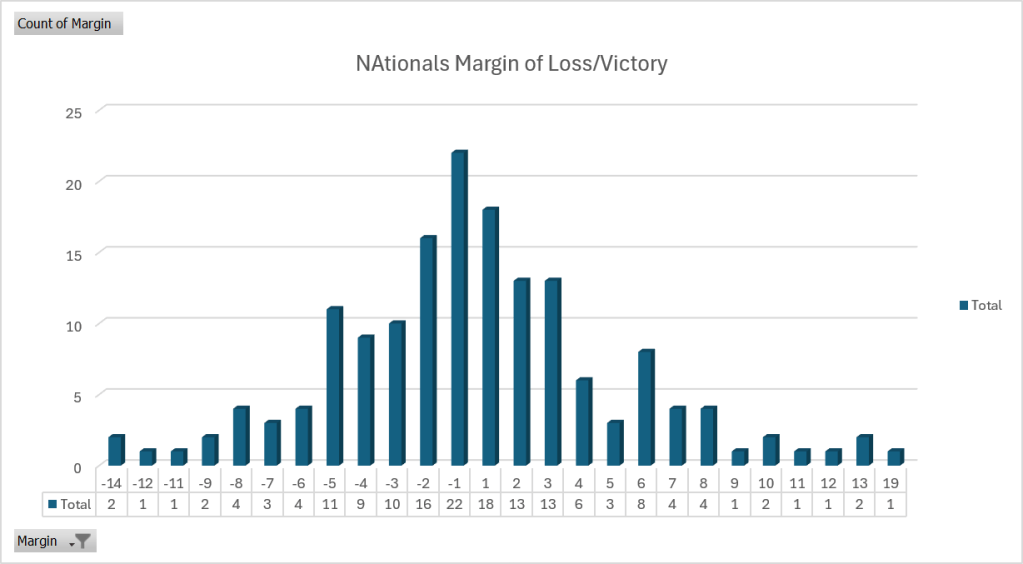
And here are the records
| Margin | Record |
|---|---|
| 1 or 2 runs | 31-38 |
| 3 or 4 runs | 19-19 |
| 5 or 6 runs | 11-15 |
| 7+ runs | 16-13 |
So the Cubs won only 4 more games than the Nationals when the margin was 4 or fewer runs. But the Nationals pitching was very bad, and they suffered 12 more blow-out losses.
One other thing to look at was how many runs the Cubs scored when they lost close games
| Cubs Runs Scored | Gave Lost by less than 4 runs |
| 0 | 9 |
| 1 | 9 |
| 2 | 10 |
| 3 | 9 |
| 4 | 6 |
So in close losses, the Cubs scored fewer than 5 runs 43 times.
Here are the Brewers numbers
| Brewers Runs Scored | Gave Lost by less than 4 runs |
| 0 | 4 |
| 1 | 6 |
| 2 | 12 |
| 3 | 12 |
| 4 | 5 |
The big story here is that the Cubs were shutout or scored 1 run 18 times in games decided by fewer then 4 runs, when this only happened to the Brewers in 10 games.
The bottom line is that when the Cubs offense was good, it was very good. But when it was bad, it was anemic. Hopefully, they can find a more happy medium in 2027, and spread those runs around to win more close games.


Leave a comment